


The Scout Vision Top 5 for 5 Quarterly Report, Part II (Q3 2017)
In Economically Flatlined Central and Western New York State, Anemic Appreciation is Nothing new…but is Boulder Also “Over”?![]()

The latest Scout Vision® Trends & Forecasts quarterly report reveals that 3 out of the 5 top U.S. Metro Areas predicted to decline in real estate prices through 2022 have an “Erie” connection: Two Metros are set along the Erie Canal, through economically flatlined Central and Western New York State, while the third–the Erie, PA Metro Area–is just over the border.
Perhaps the bigger story: according to Scout Vision forecasts, after years of increasing median home values, the Boulder, CO Metro Area, home of the iconic Flatirons, has hit its peak.
Rust Belt Blues Continue, While the Boom in Boulder is Over
In the Great Lakes region of the Rust Belt, dotted along the Erie Canal and Lake Erie, are cities and towns encompassing the Syracuse, NY; Buffalo-Cheektowaga-Niagara Falls, NY; and Erie, PA Metro Areas.
Aside from a few locations that are slowly, yet successfully, reinventing themselves (Pittsburgh, PA comes to mind), the Rust Belt continues to symbolize economic decline: the loss of manufacturing jobs, population stagnation or decline, and of course, real estate prices (see Figure 1).
Figure 1

While median home values in these three Rust Belt metro areas are expected to fall only .5 to 1.5% over the next 5 years (see Figure 2), indicators suggest that a near-term turnaround isn’t imminent. In addition to weak job and population growth, the rate of new housing construction in all three Metro Areas has been among the lowest in the nation–and in most cases, the rate of vacancies among the highest–over the past two years.
To make matters worse, the number of years needed to buy the average home in the Buffalo-Cheektowaga-Niagara Falls Metro Area is at a twenty year high (2.63 years), making homeownership in this area, even with all of its flaws, less affordable for the average household than it historically has been.
Figure 2

Anemic appreciation is nothing new in the Rust Belt region. But what about the Boulder, CO Metro Area? Clean air, beautiful mountains, and physically fit people abound, the region appears to have everything the Rust Belt does not: a growing population, a strong job market, increasing wages and new housing stock (see Figure 3).
Figure 3

However, just because the region’s population continues to grow, new housing continues to be built, and wages continue to rise doesn’t mean that real estate prices will do the same.
Among these positive metrics belies one major negative: housing affordability in the Boulder, CO Metro Area is at a historical low. It now takes 6 years of average income—among the highest in the nation—to buy an average home in the region. Housing in the Boulder area has never been this unaffordable to people living in the area, one indicator of a housing bubble.
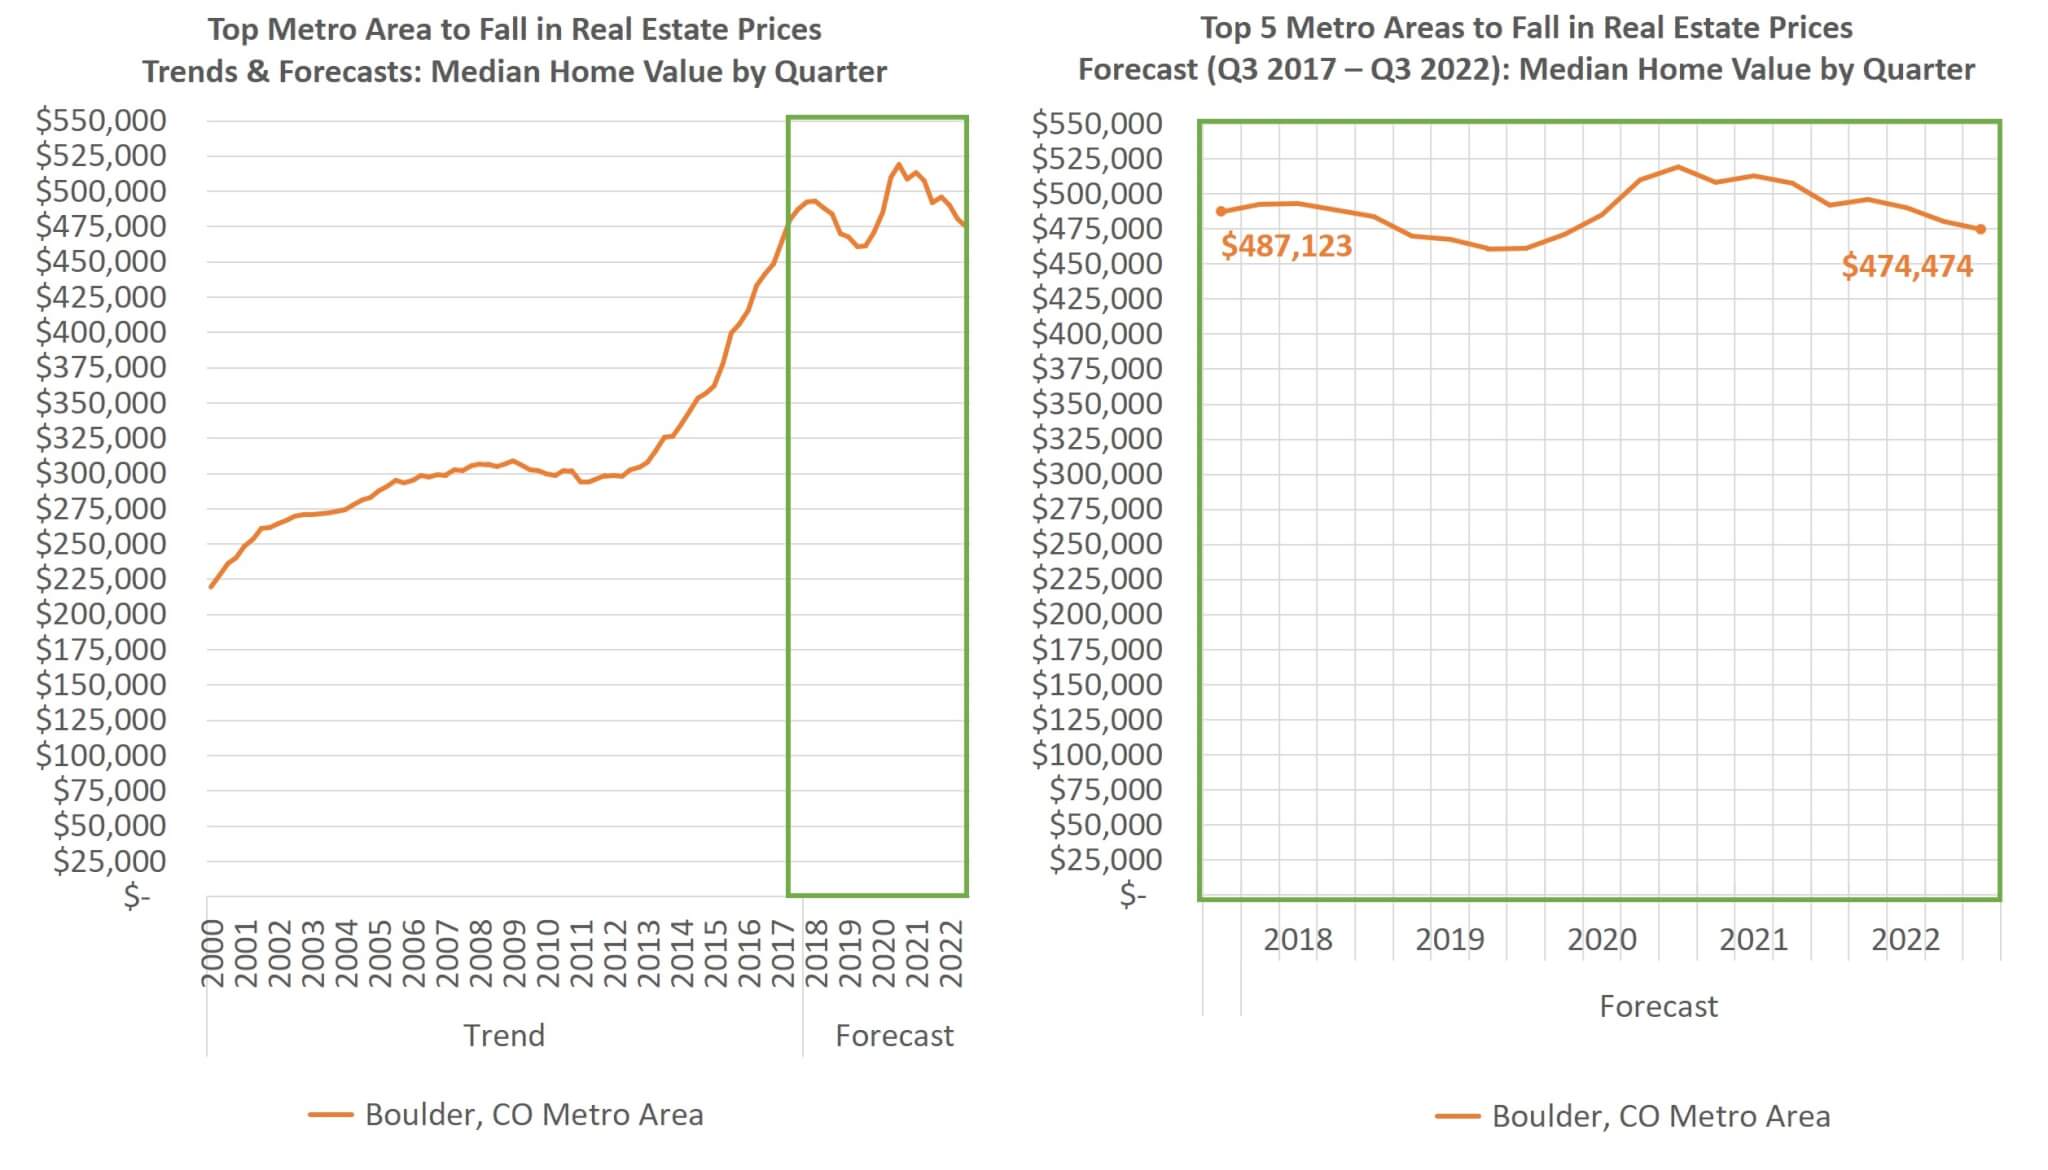
Once real estate prices rise faster than income growth, a correction or leveling is in order. After 17 years of almost steadily increasing median home values—the last five being high-flying growth (see Figure 4)—the Boulder, CO Metro Area is ready to retire its time at the top.
Figure 4
Coming Up: The Scout Vision® Top 5 for 5 Quarterly Report, Q4 2017
Stay tuned for our next Scout Vision Quarterly Report in December, where we will reveal historic trends and forecasts for the Top 5 U.S. Metropolitan Areas Predicted to Rise and Fall in Real Estate Prices Over the Next 5 Years.
About the List
Metropolitan areas are ranked by overall forecasted appreciation. But the lists above also highlight significant variation in forecasted appreciation by neighborhood within each metro.
Sometimes the variation from the lowest forecasted appreciation neighborhood to the highest can be greater than the overall forecasted appreciation for that metro. This reveals that – as many investors, lenders and appraisers have experienced – much of the opportunity and risks depend on where in the metro area the subject property is located. Not just the broad ZIP Code, but the specific Micro-Neighborhood.
About the Data
Industry veterans and PhD geographers developed Scout Vision by drawing on over a decade of research and development and leveraging the latest geo-statistical techniques and theory. Scout Vision’s 5-year Micro-Neighborhood™ Home Price Forecast is based on 200+ independent variables, 35+ unique data dimensions, and 21 custom, geographically nested, hierarchical models that capture market forces which operate at various spatial and time scales to drive price changes block by block.
Thus, Scout Vision uniquely identifies otherwise unseen opportunity by generating home appreciation projections that combine unprecedented geographic precision with up to 90% predictive accuracy.
Licensing Scout Vision Enterprise Today
For real estate investment firms with 500+ properties or companies needing API or large bulk file processing, request a data sample of up to 10 addresses and discover what Scout Vision Enterprise can do for your firm.
For real estate investment firms with fewer than 500 properties or individuals with independent investments, take advantage of Scout Vision’s forecasting capabilities through a NeighborhoodScout Pro Subscription.